Register to Continue (Scroll Down to Learn More)
Benefits of Sponsorship/Registration
SchoolSparrow Partner Agents
Our Partner Agents are the lifeblood of SchoolSparrow. They are trained to conduct school focused home searches, and they will help you avoid pitfalls when it comes to your School+Home search, for example, what if your school of choice is talking right now about changing the boundaries? SchoolSparrow agents have tools to make your life easier when it comes to selecting schools. We'll show you 30 schools that could work for you based on your real estate needs. and your Partner Agent will help guide you to rescources so you can narrow down the list based on your childs needs. Already know which School is right for your family? Perfect! Our Partner Agents are aware of off-market listings in the boundaries of your School of Choice. Let SchoolSparrow introduce you to the right Agent for your Search. Connect with an Agent Today

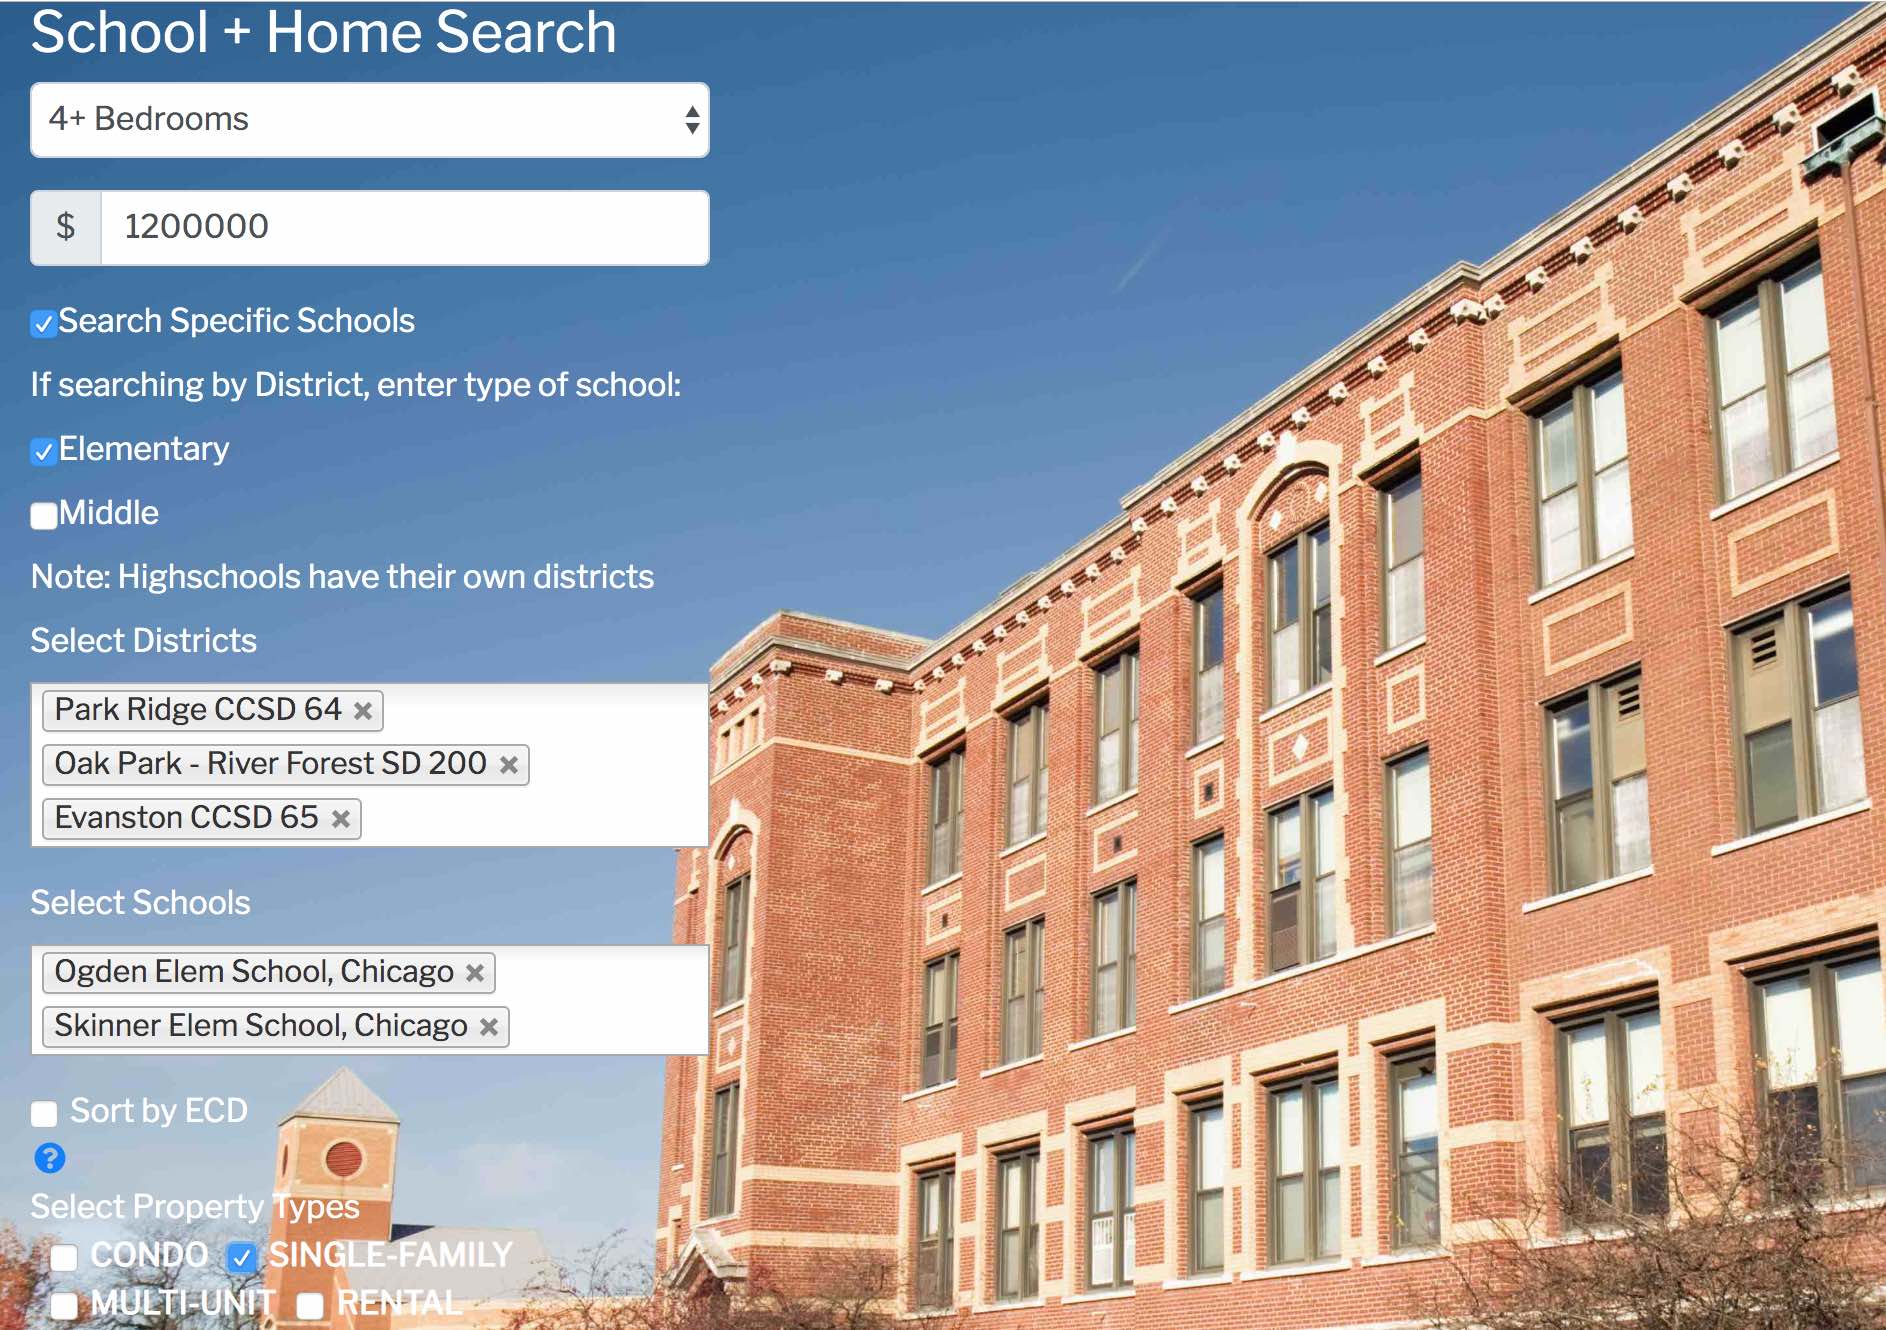
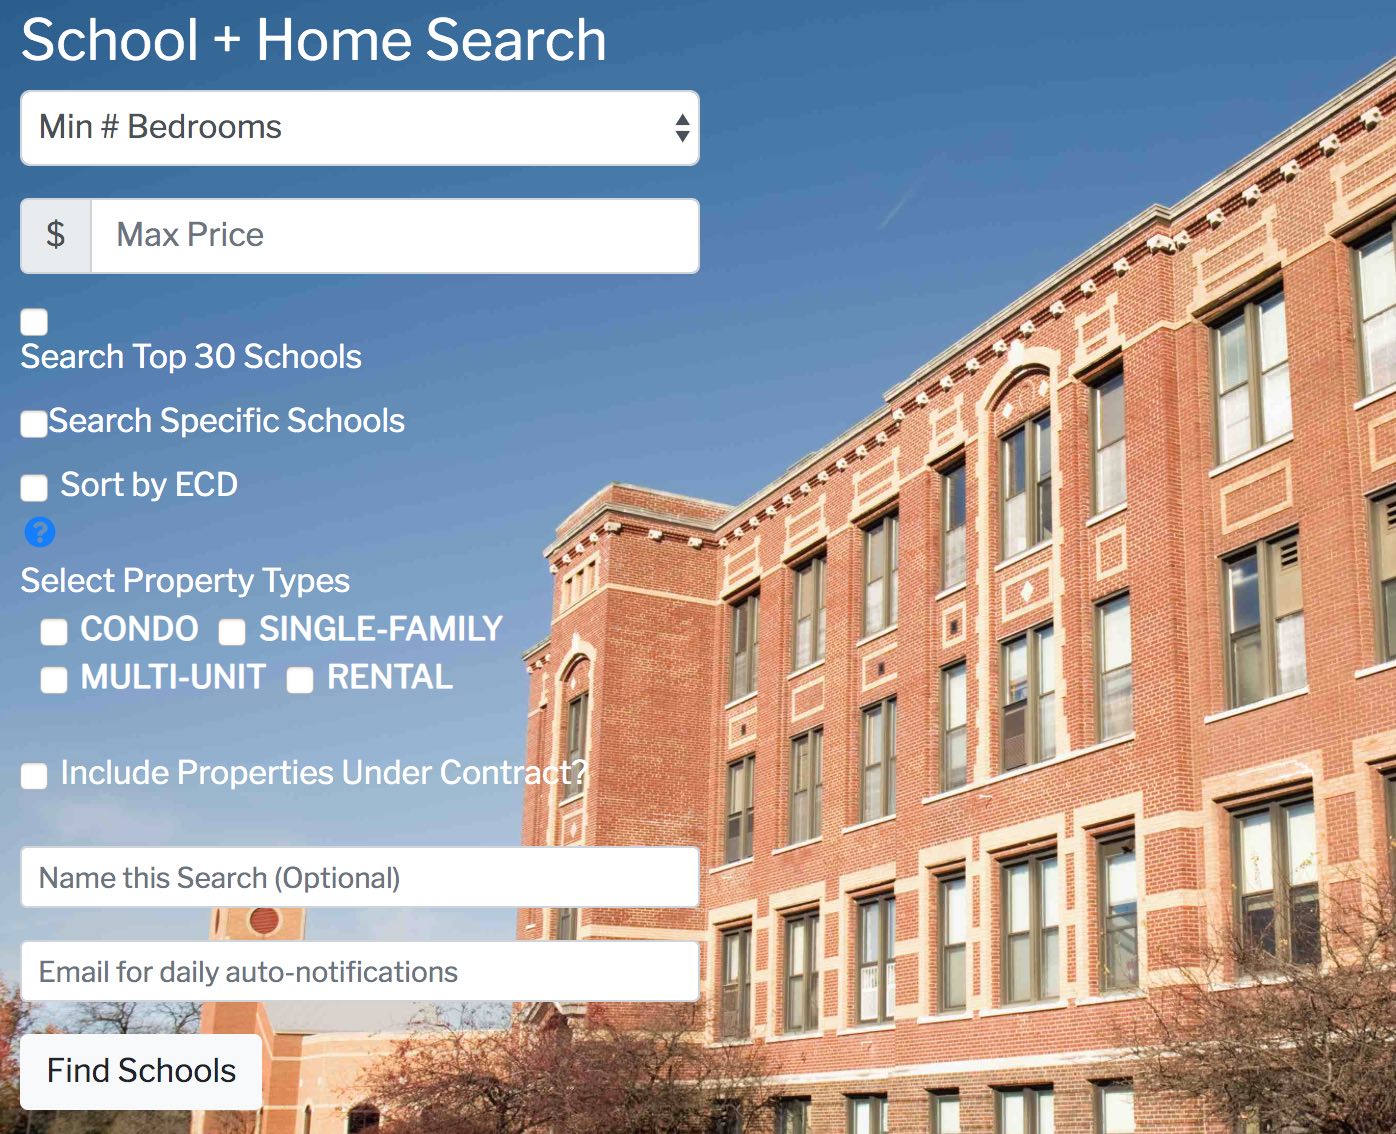
Try Our Advanced Search to Search Specific Schools and/or Districts
Find Homes in multiple schools or districts simultaneously.
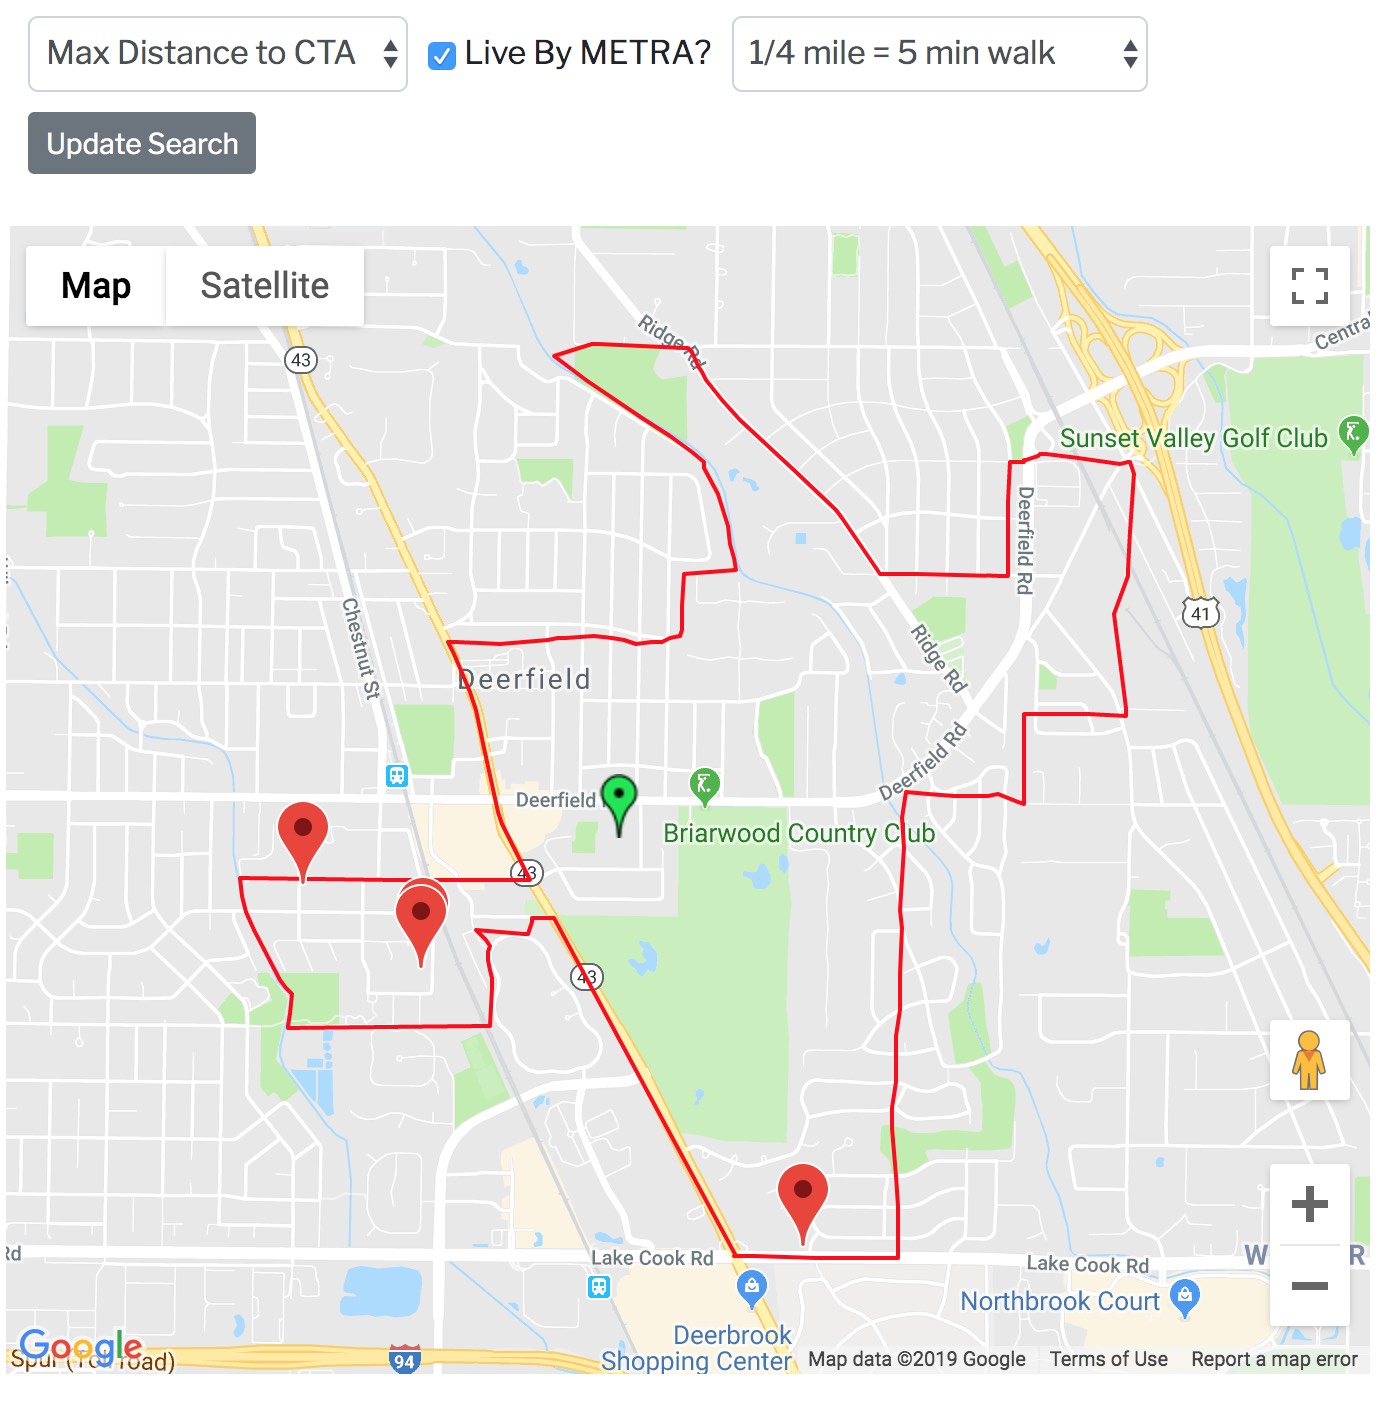
LiveByTransit
If you select this option, we will return properties, in your school boundaries, that are also within your defined walking distance of either a CTA or Metra train.
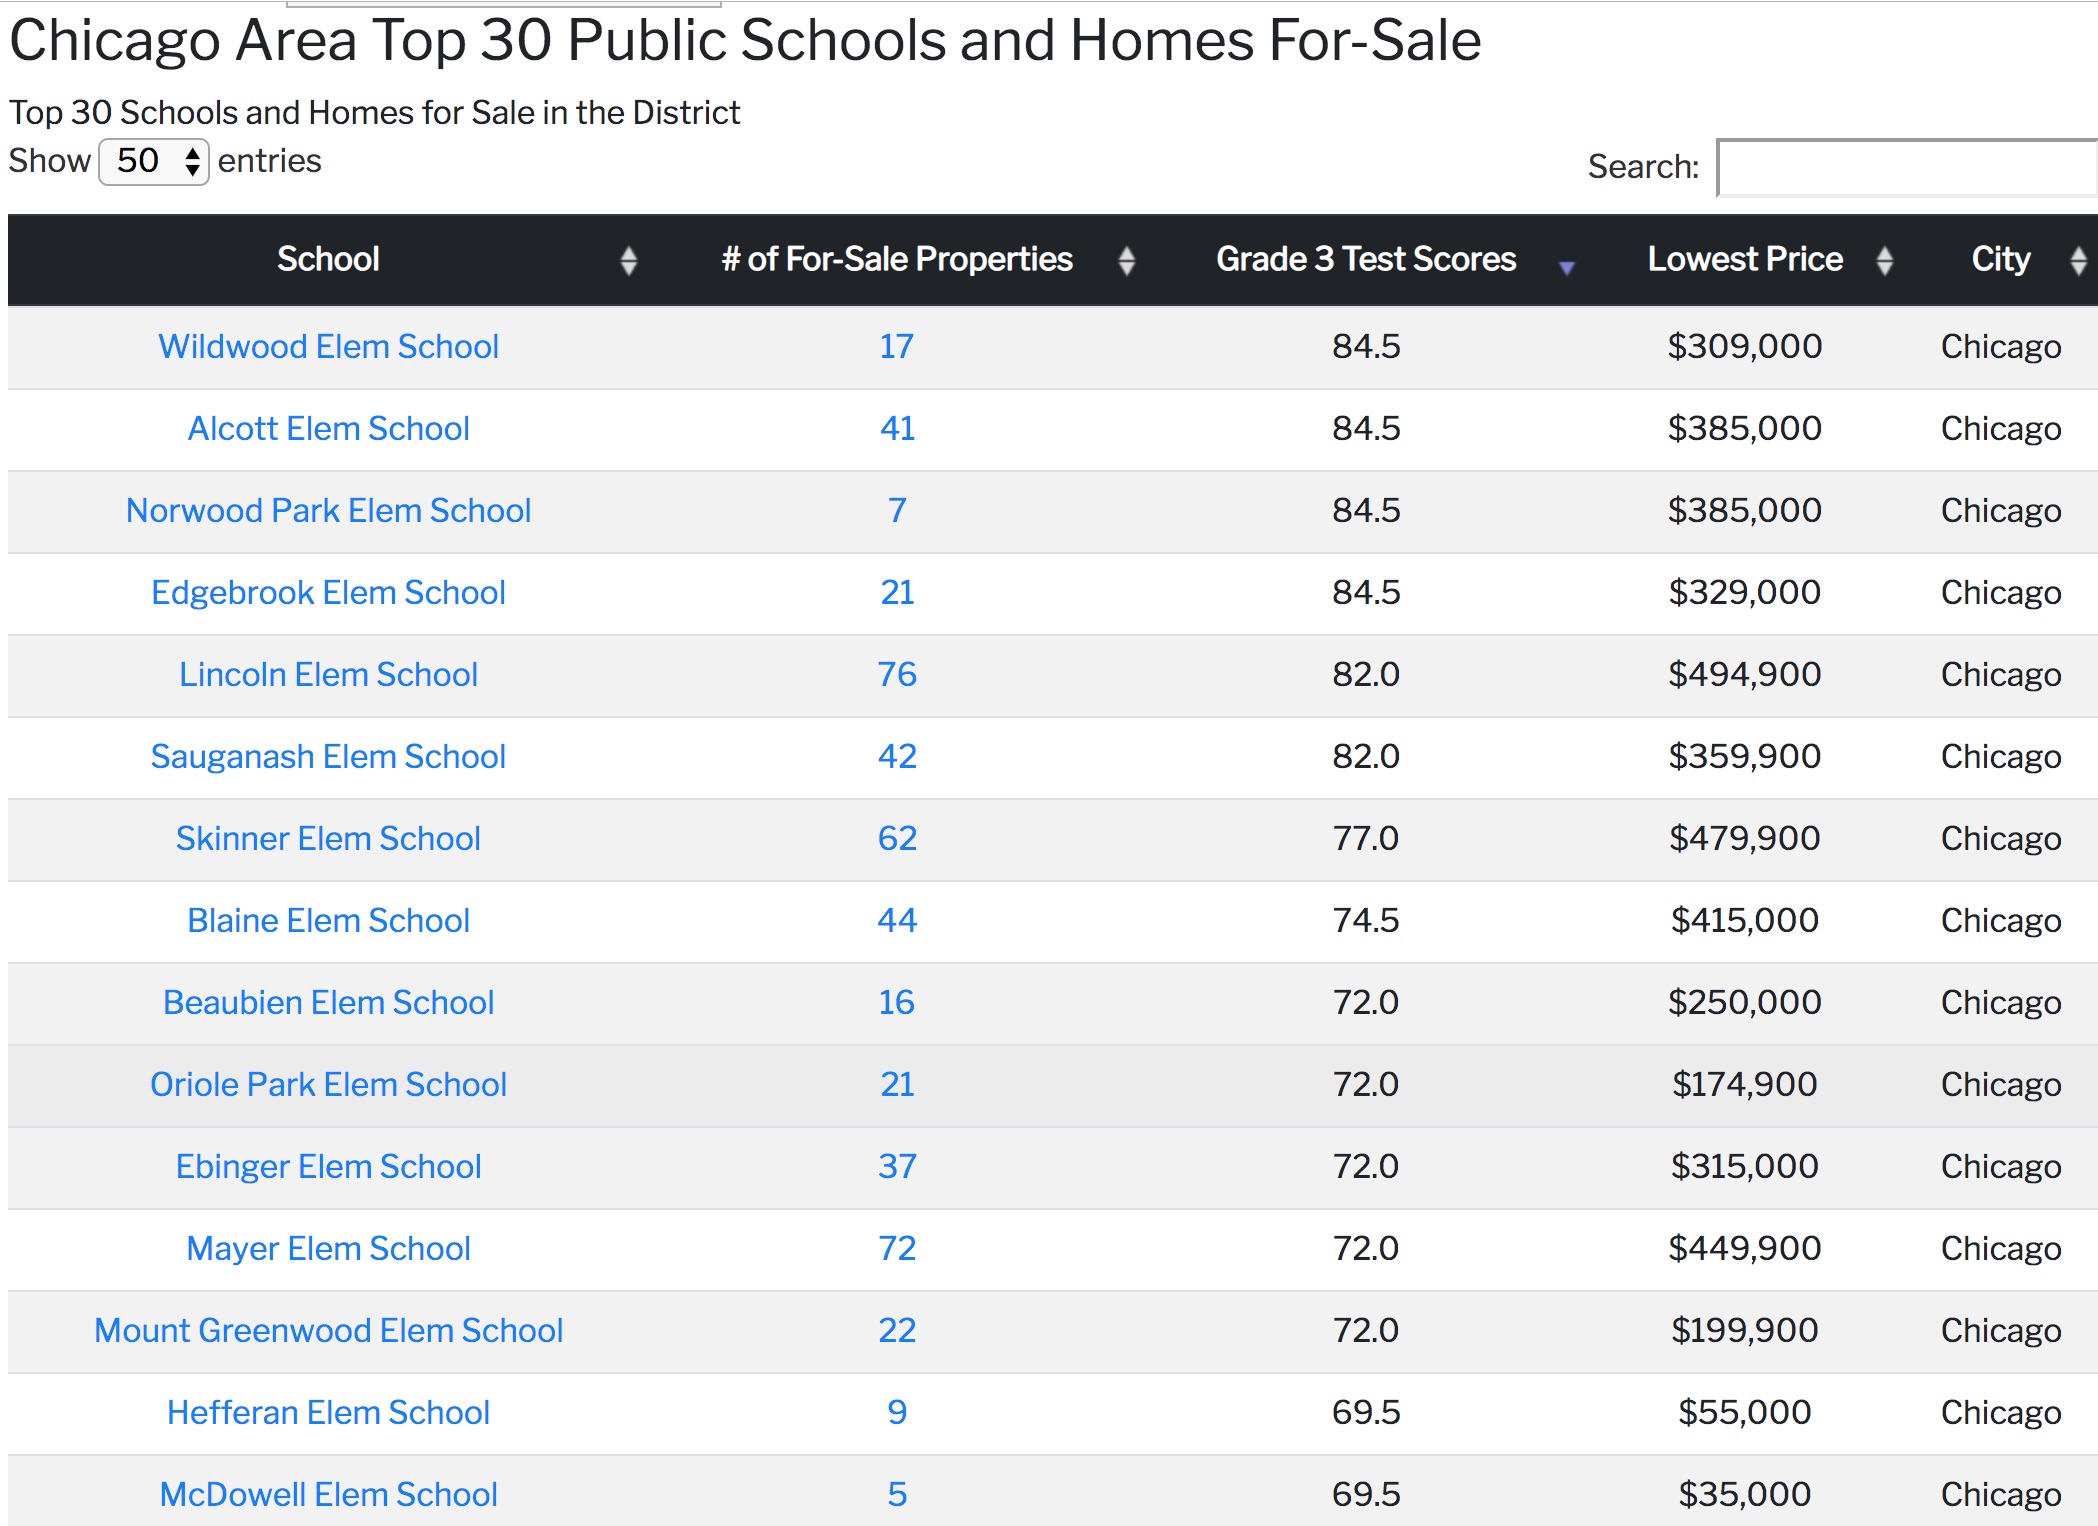
Top 30 School Search
Not sure which specific schools to search? Our top 30 search will find the Top 30 schools that have homes for sale right now that match your requirements!
Email Auto-notify*
Get Daily Email Auto-Notifications of New or Updated Properties in Your School(s) Attendance Boundaries


ECD Search
Try our ECD ranking option which ranks schools based on the test performance of the Economically Disadvantaged students at the school. Inspired by this post.
More Search Options
Get advanced search options to further narrow down your search results to include schools with properties that more closely match your requirements.
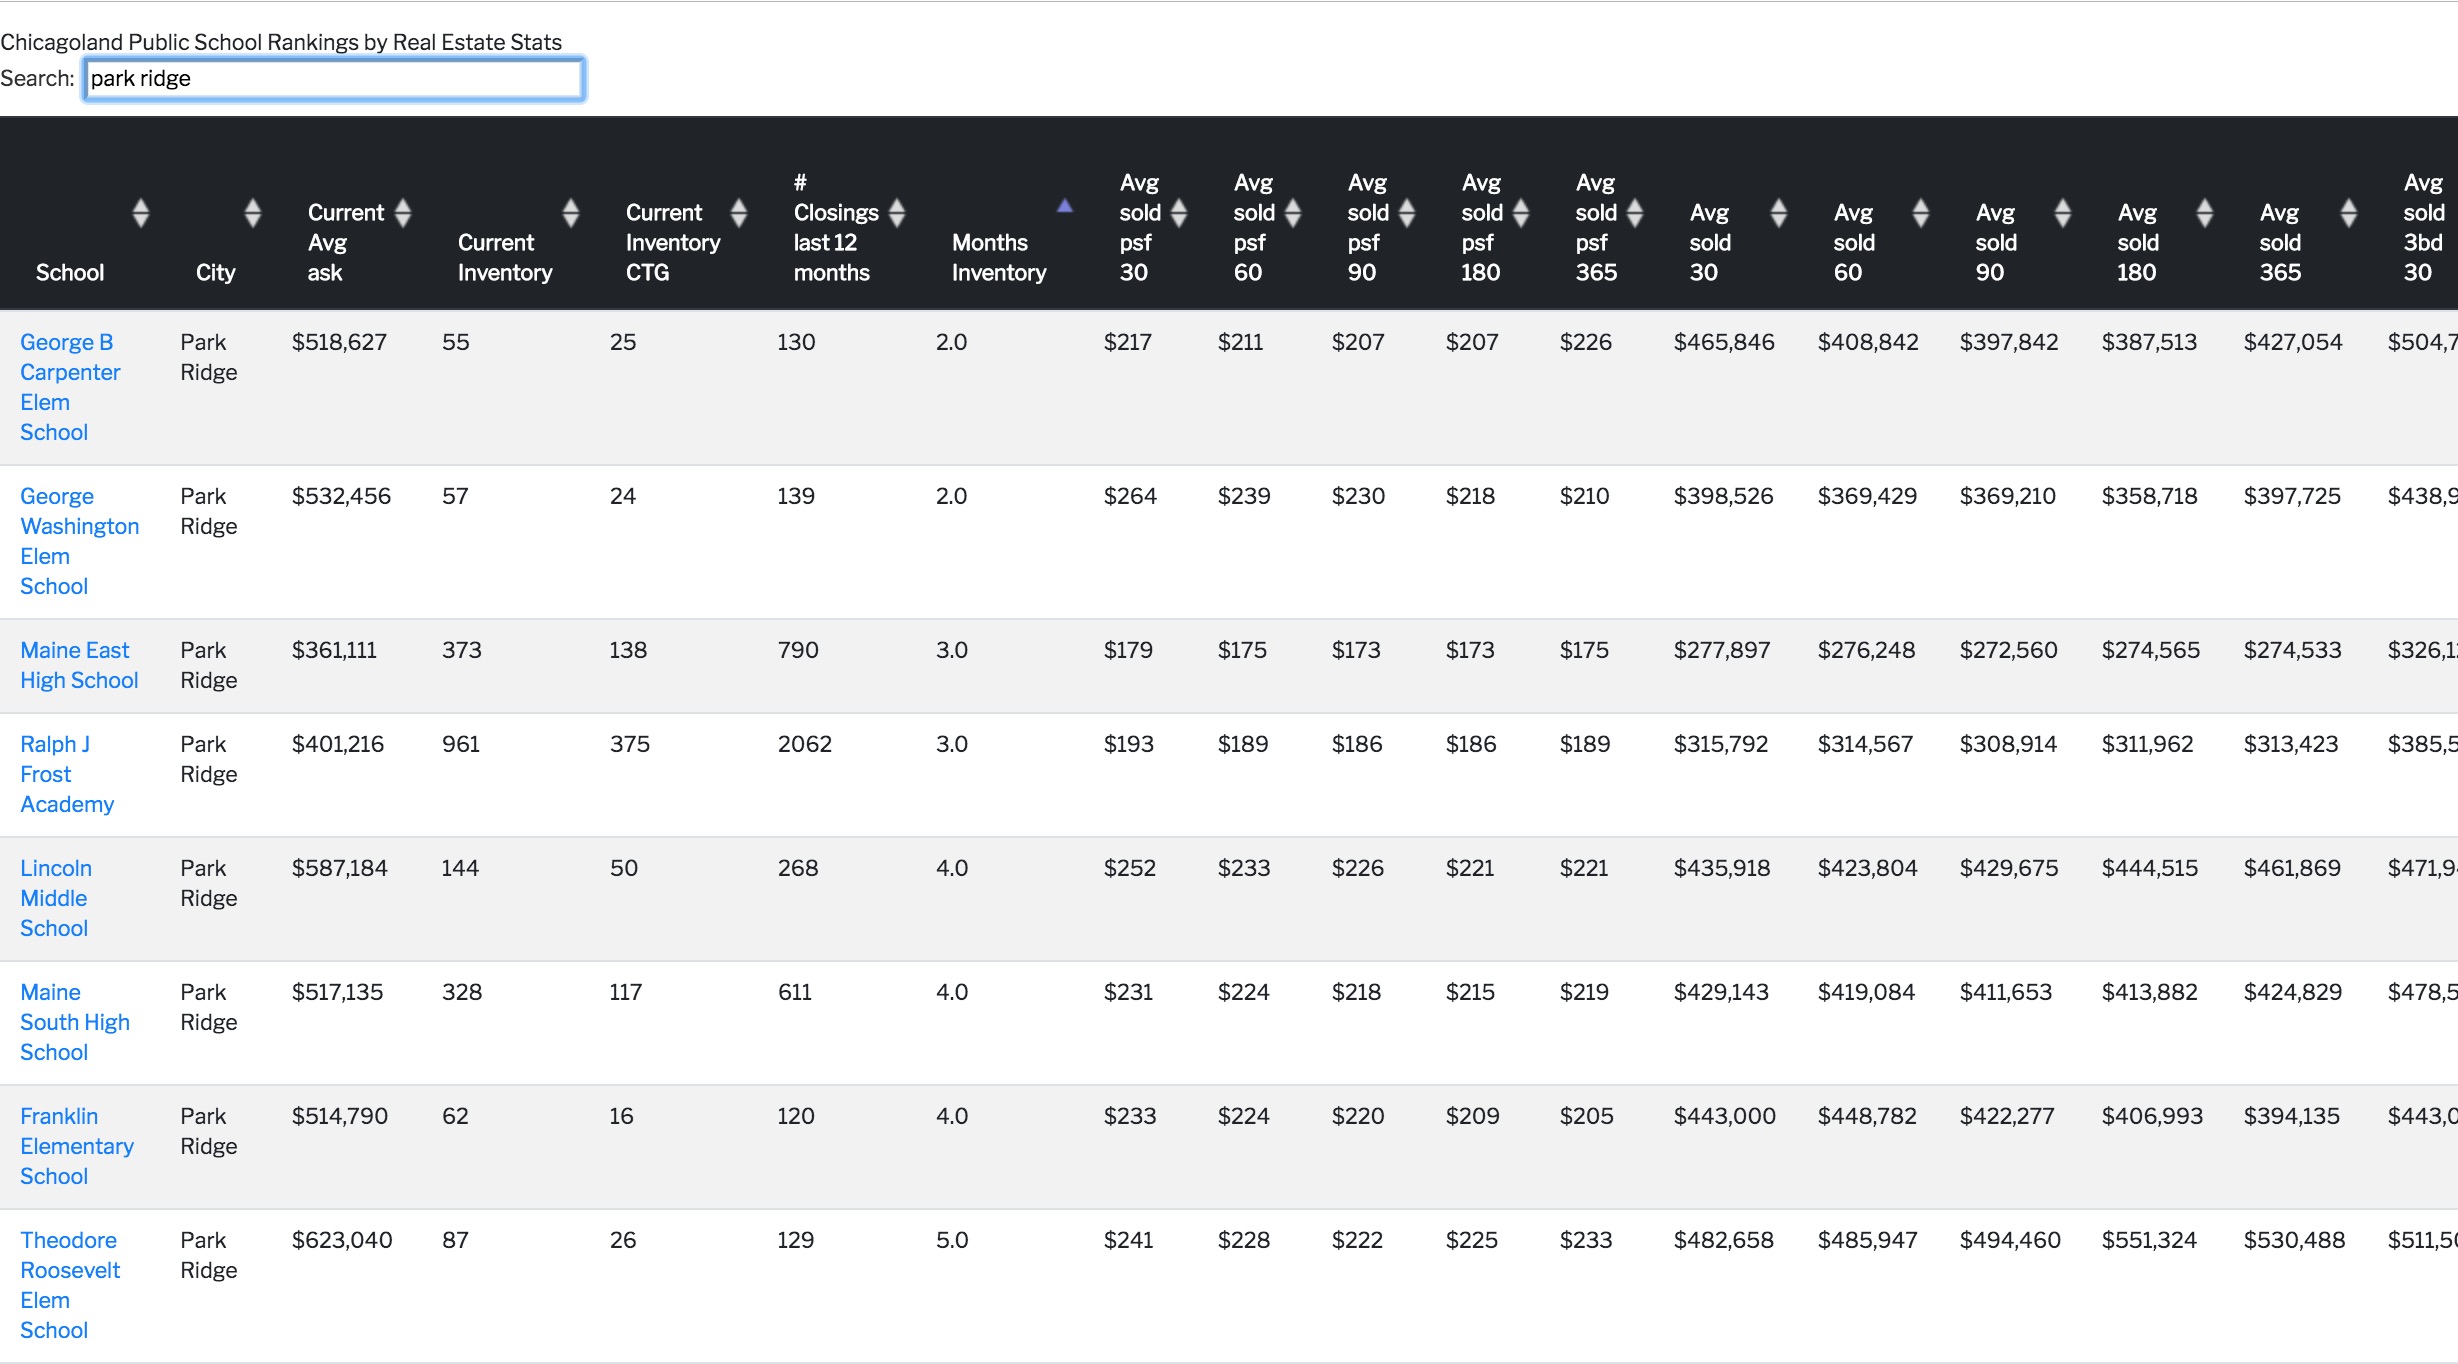
School-based Real Estate Data*
You get exclusive access to our real-time comprehensive Real Estate data, sortable and segmented by School.
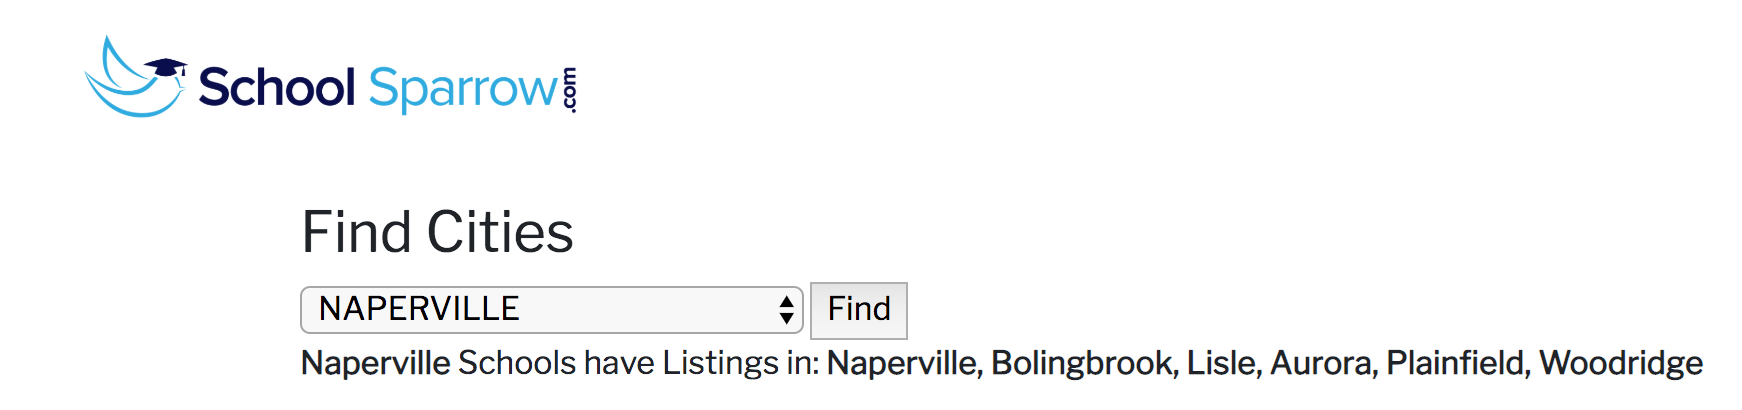
Find Cities*
For Suburban buyers, you need this to be sure you are seeing all available properties in your school boundaries.