Model Validation provided by NUMERIOUS INC.
Numerious Validation and Endorsement
Numerious has certified SchoolSparrow's algorithm as valid to use for rating public schools in the United States.
SchoolSparrow’s algorithm calculates the number of students, on average, that should be deemed proficient on the Reading/Language Arts (RLA) section of the standardized test at any given school. Among other variables, the algorithm takes into account the number of economically disadvantaged students (ECD) and the number of students with disabilities (CWD).
Using the data set provided by the US Dept of Education, Numerious was able to replicate SchoolSparrow’s model. Numerious also looked at indicators of how correlated the test scores are to income demographics, and the model’s goodness of fit.
The actual distribution of the number of kids deemed proficient at US schools and the distribution of the model's predictions is remarkably strong. The predictions are nearly 84% correlated.
Numerious’ review of SchoolSparrow’s algorithm indicates a high correlation between a school’s economic demographics and population of children with disabilities. Our analysis shows that SchoolSparrow’s algorithm also displays goodness of fit based on several indicators.
Illinois-Chicagoland Public School Rankings
Column Definitions
NOTE: Our SEARCH BAR is powerful. You can filter by City, School Level, District, and Name SIMULTANEOUSLY.
SchoolSparrow Rating
Income Adjusted Percentile
Expected Scores
Diversity Score
% ECD
SchoolSparrow Value Index
SchoolSparrow Rating
Our score is derived from each schools final percentile ranking for the State.
| Percentile Range | SchoolSparrow Score |
|---|---|
| 93-100% | 10 |
| 79-93 | 9 |
| 65-79 | 8 |
| 51-65 | 7 |
| 44-51 | 6 |
| 37-44 | 5 |
| 30-37 | 4 |
| 23-30 | 3 |
| 16-23 | 2 |
| 0-16 | 1 |
Income Adjusted Percentile
First, an imporant note: a low percentile DOES NOT mean a school is "bad". Maybe the school doesn't focus on the test. Maybe the environment on the day of test taking had an impact. School's are complex ecosystems, and one number cannot possibly encapture all that makes a child love her school. School's are not "bad" or "good". School's have strengths and weaknesses. After our system is more established, we will move away from giving one grade to schools in the US, and instead create a customizable rating system based on what YOU as a parent think are the the important factors.
Income Adjusted Percentile describes where this school ranks among schools in the entire State in which the school is located. School's are ranked by the difference between each school's expected and actual scores. The percentile's are rounded up to the nearest whole number.
For example, A school at the 60th percentile (60%) is exceeeding expectations to a greater degree than 60% of schools in the state. This same school is in the top 40% of schools in the state when it comes to exceeding test score expectations.
Another way to think about our percentile score is "among other schools where parents have similar income profiles, this school is at X percentile"
The expected score of a school is a function of the socio-economic profile of the school, and the school's population of CWD (Children With Disabilities) students that took the test. Other ratings sites don't do this, resulting in biased ratings that don't tell the truth about the quality of the school.
To further illustrate this point, imagine two schools with the same test scores. When it comes to the test score component of the ratings system on other websites, these two schools are indistinguishable.
But what if you then receive information that one school is located in a ritzy suburb and the students primarily come from high income families, and the other is located in the inner city and the students primarily come from lower income families?
On our system, the school in the inner city gets recognized with a higher score. Their success is more likely due to the impact of the school, and they are not simply benefiting from high performing students from high income households. Other ratings sites do not allow this school to be illuminated, and as a result, some parents are steered away from the homes and neighborhoods that this school serves.
Expected Scores
The expected score is the score predicted by SchoolSparrow's algorithm. This score represents the average or expected score on the RLA portion of the test dependent on, among other variables, each school's popluation of ECD (Economically Disadvantaged) and CWD (Children With Disabilities) test takers.
SchoolSparrow's algorithm provides more truth about school quality because the impact of economic demographics on student test scores vastly outweigh the impact of teachers/schools. By controlling for economic demographics in our unique algorithm, SchoolSparrow's rating system delivers more equitable and fair ratings when it comes to student performance. In addition, a school's population of children with disabilities can have an effect on test scores. Our system accounts for schools that have low or high populations of children with disabilities.
When the expected score is compared to any school's actual scores, the schools at which teachers are truly making a difference can be more easily identified.
Diversity Score
The diversity score is informational and provides an indication of the racial diversity of each school. The max score is 40 points. Schools where at least 2 races are represented by at least 10% of the student body receive a 10/40. When there are 3 races each represented by at least 10%, the score is 20. 4 races represented by at least 10% or 3 represented by at least 15%, the score is 30. Finally if 5 races have 10%, or 3 races have 20% each then the score is 40/40.
School's that have high diversity, if it's done right (an important caveat), deliver measurable benefits to children. Research has shown that these environments instill better social-emotional and decision making skills, more empathy and acceptance of others, and possibly even higher IQ's.
But where can you find school's where diversity is done right? Start at our outperforming schools with high diversity. These schools tend to have strong leaders with a positive culture where racism takes a back seat to inclusion and celebration of differences, and where high morale exists among the school community resulting in low teacher turnover. Children thrive in these environments.
% ECD
This is the percentage of children at each school that were deemed economically disadvantaged as reported by the US Dept of Education.
SchoolSparrow Value Index™
SchoolSparrow calculates a price_score that describes the relationship between the SchoolSparrow Rating and the Average Price of currently listed 3-Bedroom homes in the attendance boundaries of the school. The SchoolSparrow Value Index is the percentile rank of the price score within each state or area. Schools with no Value Index do not have an attendance boundary (i.e. Magnet or Charter Schools). The higher the score, the better the value. (Chicagoland only at the moment).
A Final Note
Choosing a school for your child is an important decision. But, when it comes to the ulimate success and happiness of your child, there is one factor that far outweighs your choice of schools: YOUR TIME! An extra 30 minutes a day with your child, if it's spent wisely, overcomes the incremental difference between ANY two schools.
In addition, research studies have shown that children from a diverse environment end up with skills that are not replicable at a homogenous school.
This isn't to say that choosing a school with a longer commute and little diversity is a bad choice, rather our intention is to deliver more truth so parents can make decisions with a more enlightened view of school quality. The size of parents wallets shouldn't be a factor in determining school quality, but the ubiquitous system that is out their today is doing just that.
click for table explainer
Min Rating
Min Diversity
Min ECD
Min CWD:
Max CWD:
Check to See Map View
| School Name | School Level | Grades | City | School District |
SchoolSparrow 2018-19 Rating | SchoolSparrow 2020-21 Rating | Difference | Income Adj Percentile |
Expected Score |
Actual Score |
Diversity Score |
% ECD | % CWD | SchoolSparrow Value Index™ | Lat | Lng | ID |
|---|
Register to Continue (Scroll Down to Learn More)
Benefits of Sponsorship/Registration
SchoolSparrow Partner Agents
Our Partner Agents are the lifeblood of SchoolSparrow. They are trained to conduct school focused home searches, and they will help you avoid pitfalls when it comes to your School+Home search, for example, what if your school of choice is talking right now about changing the boundaries? SchoolSparrow agents have tools to make your life easier when it comes to selecting schools. We'll show you 30 schools that could work for you based on your real estate needs. and your Partner Agent will help guide you to rescources so you can narrow down the list based on your childs needs. Already know which School is right for your family? Perfect! Our Partner Agents are aware of off-market listings in the boundaries of your School of Choice. Let SchoolSparrow introduce you to the right Agent for your Search. Connect with an Agent Today

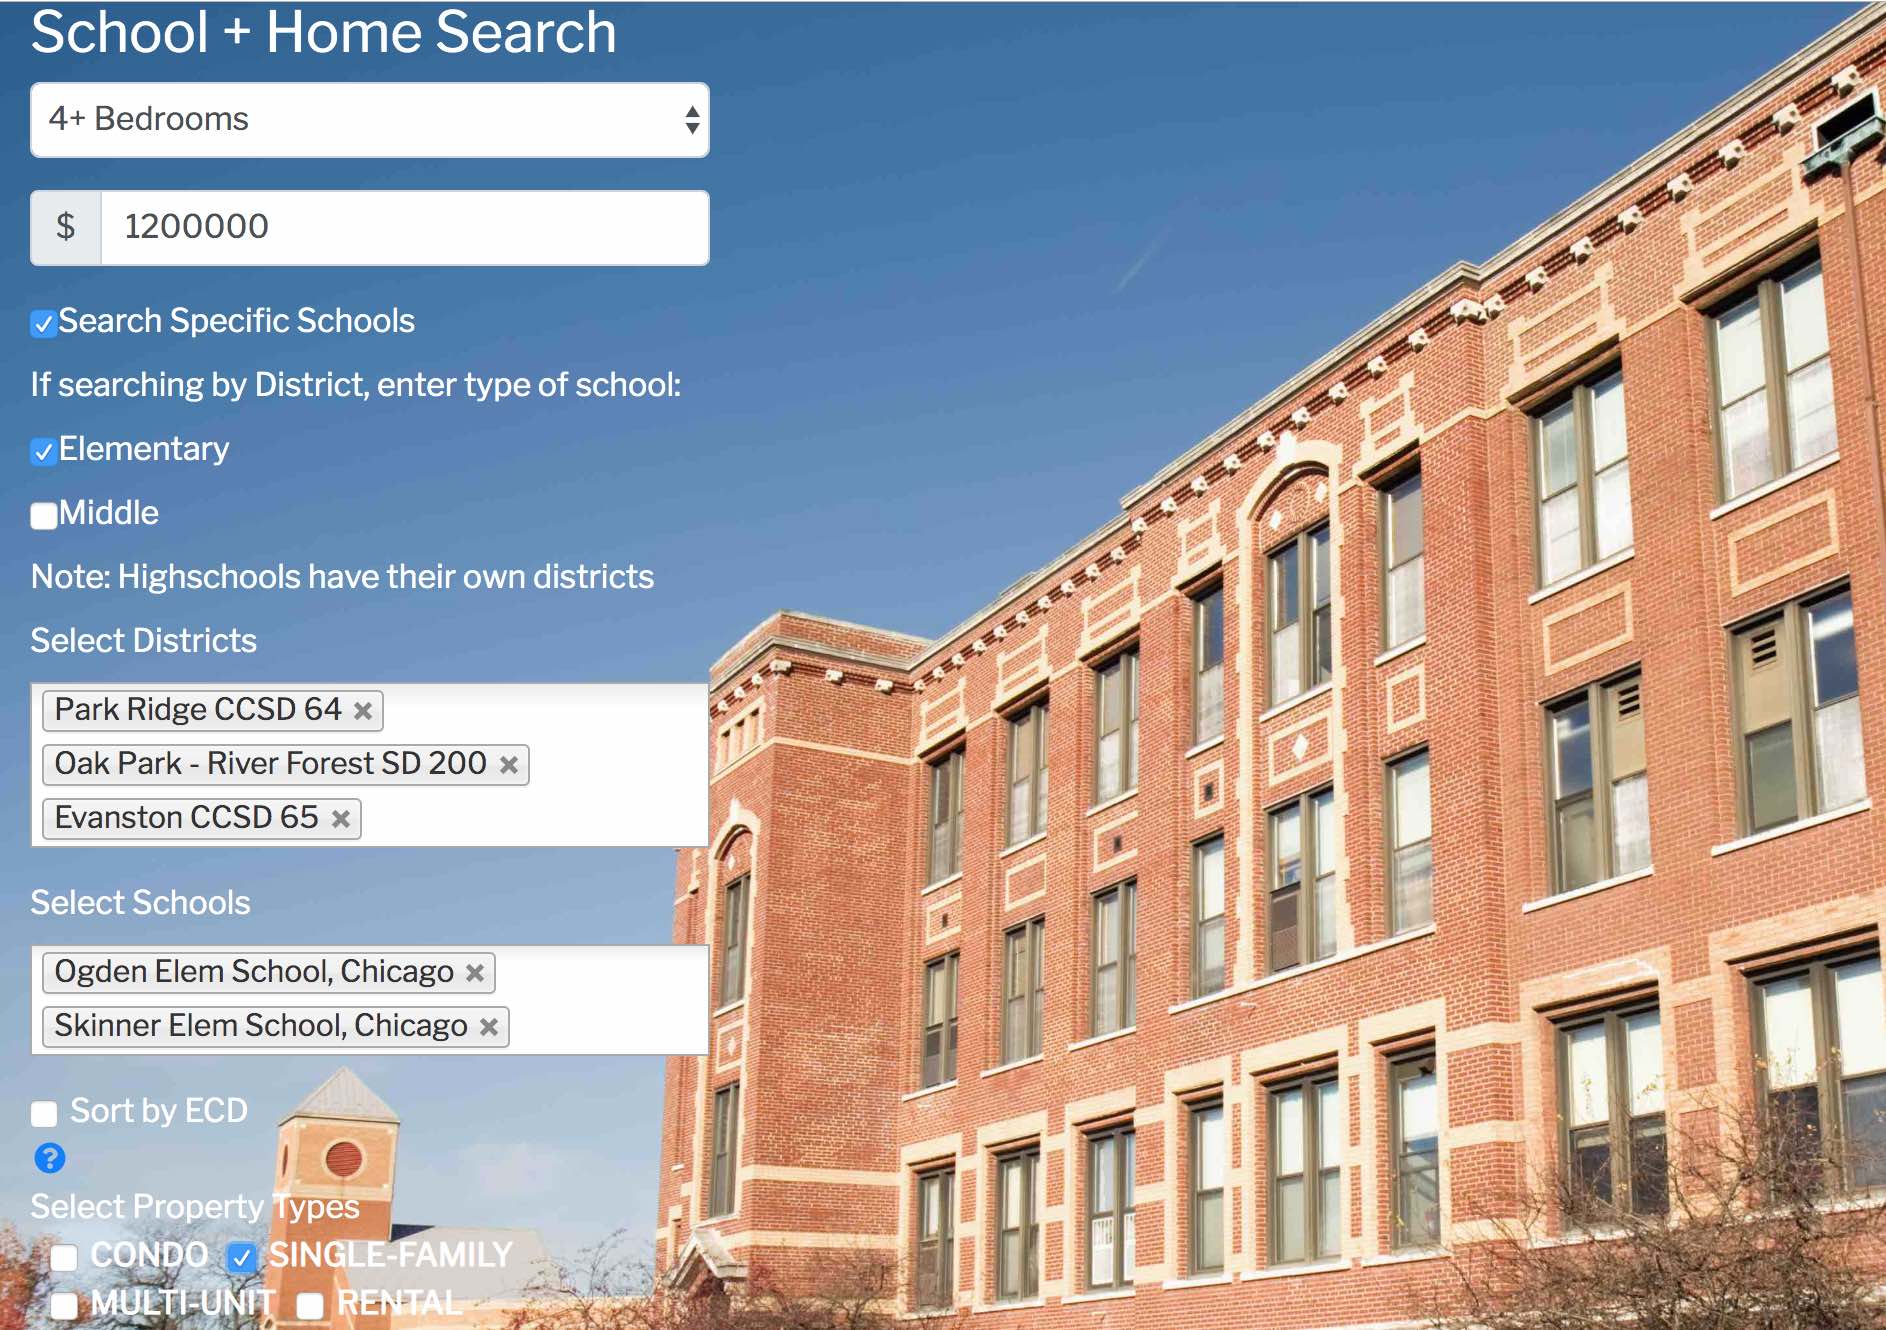
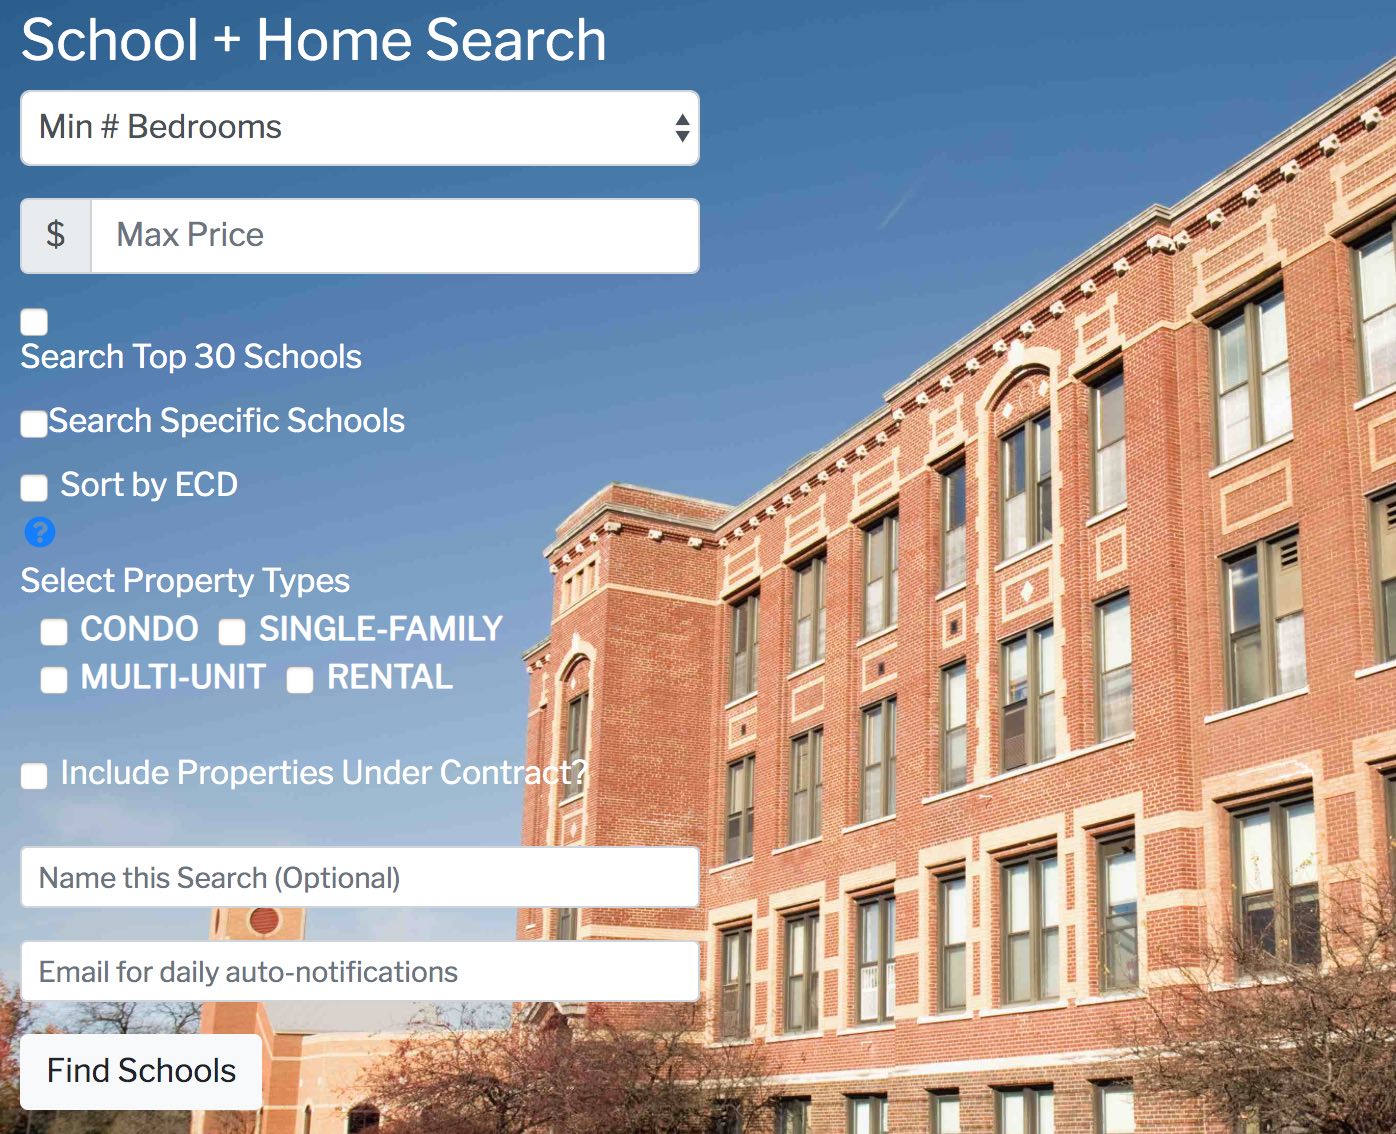
Try Our Advanced Search to Search Specific Schools and/or Districts
Find Homes in multiple schools or districts simultaneously.
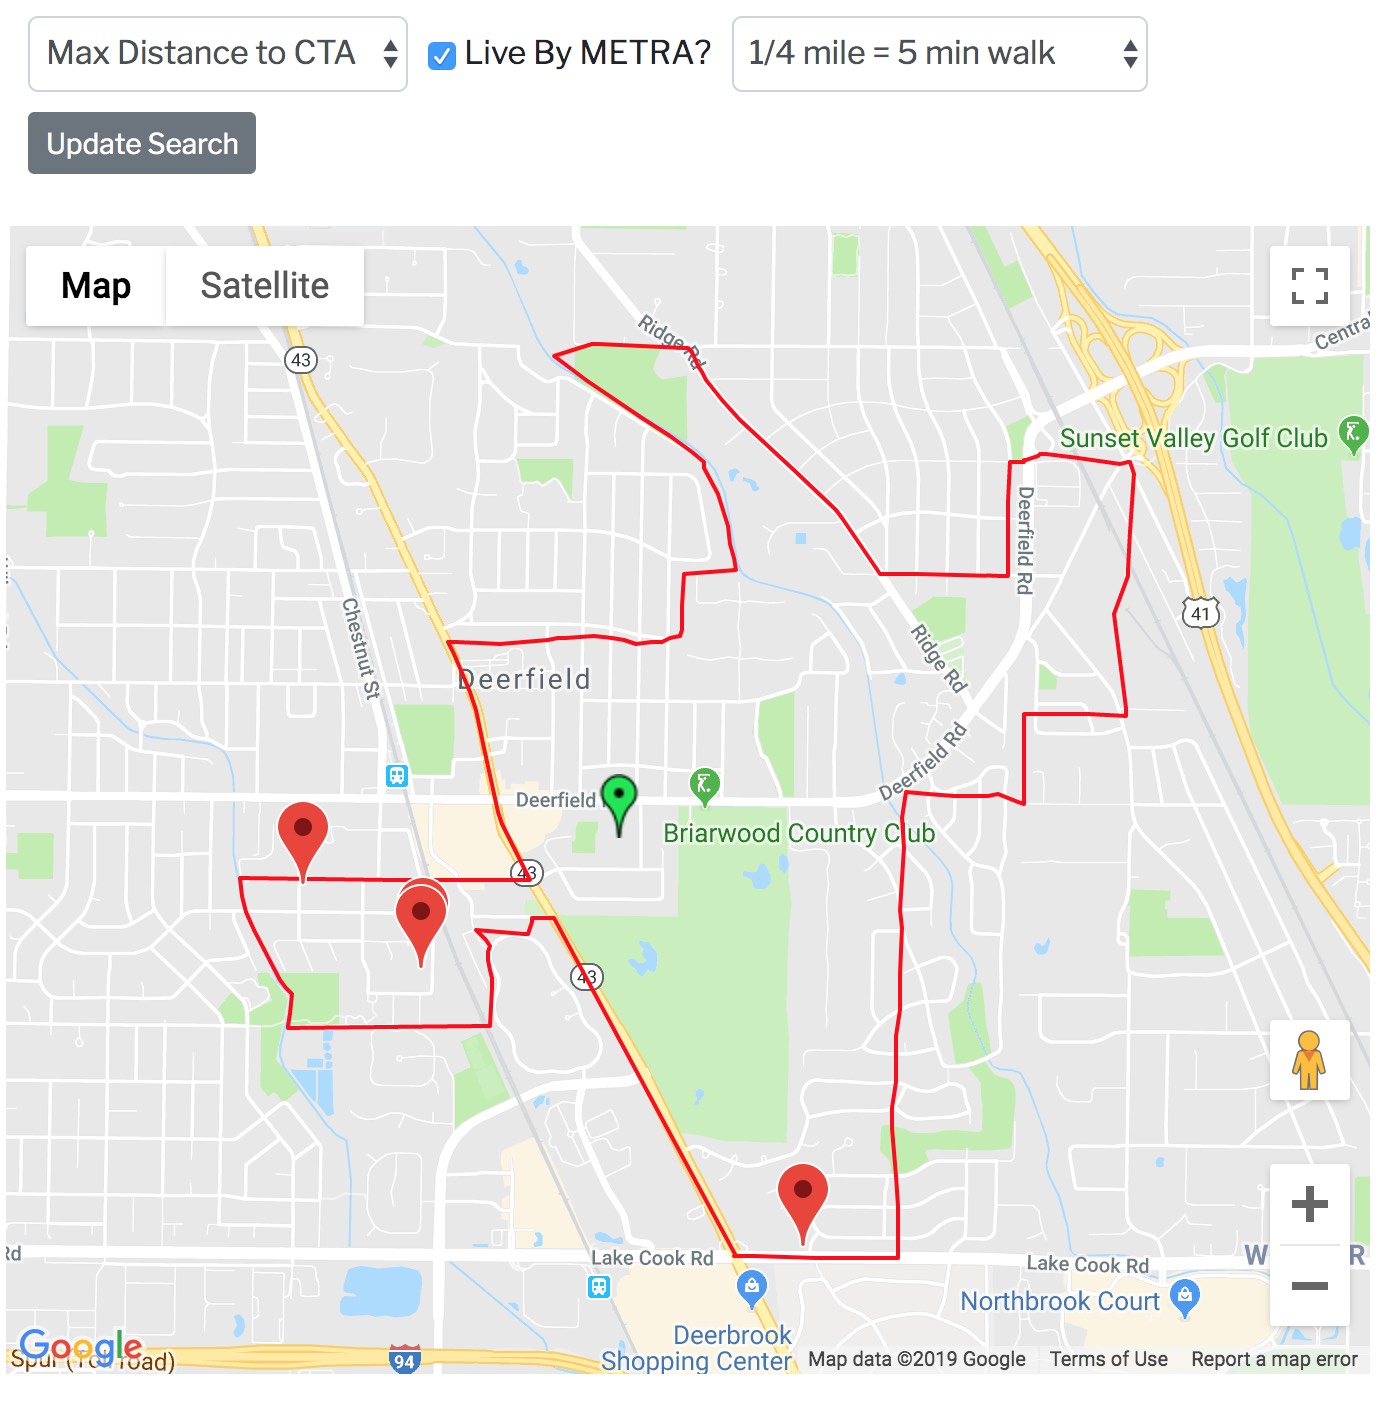
LiveByTransit
If you select this option, we will return properties, in your school boundaries, that are also within your defined walking distance of either a CTA or Metra train.
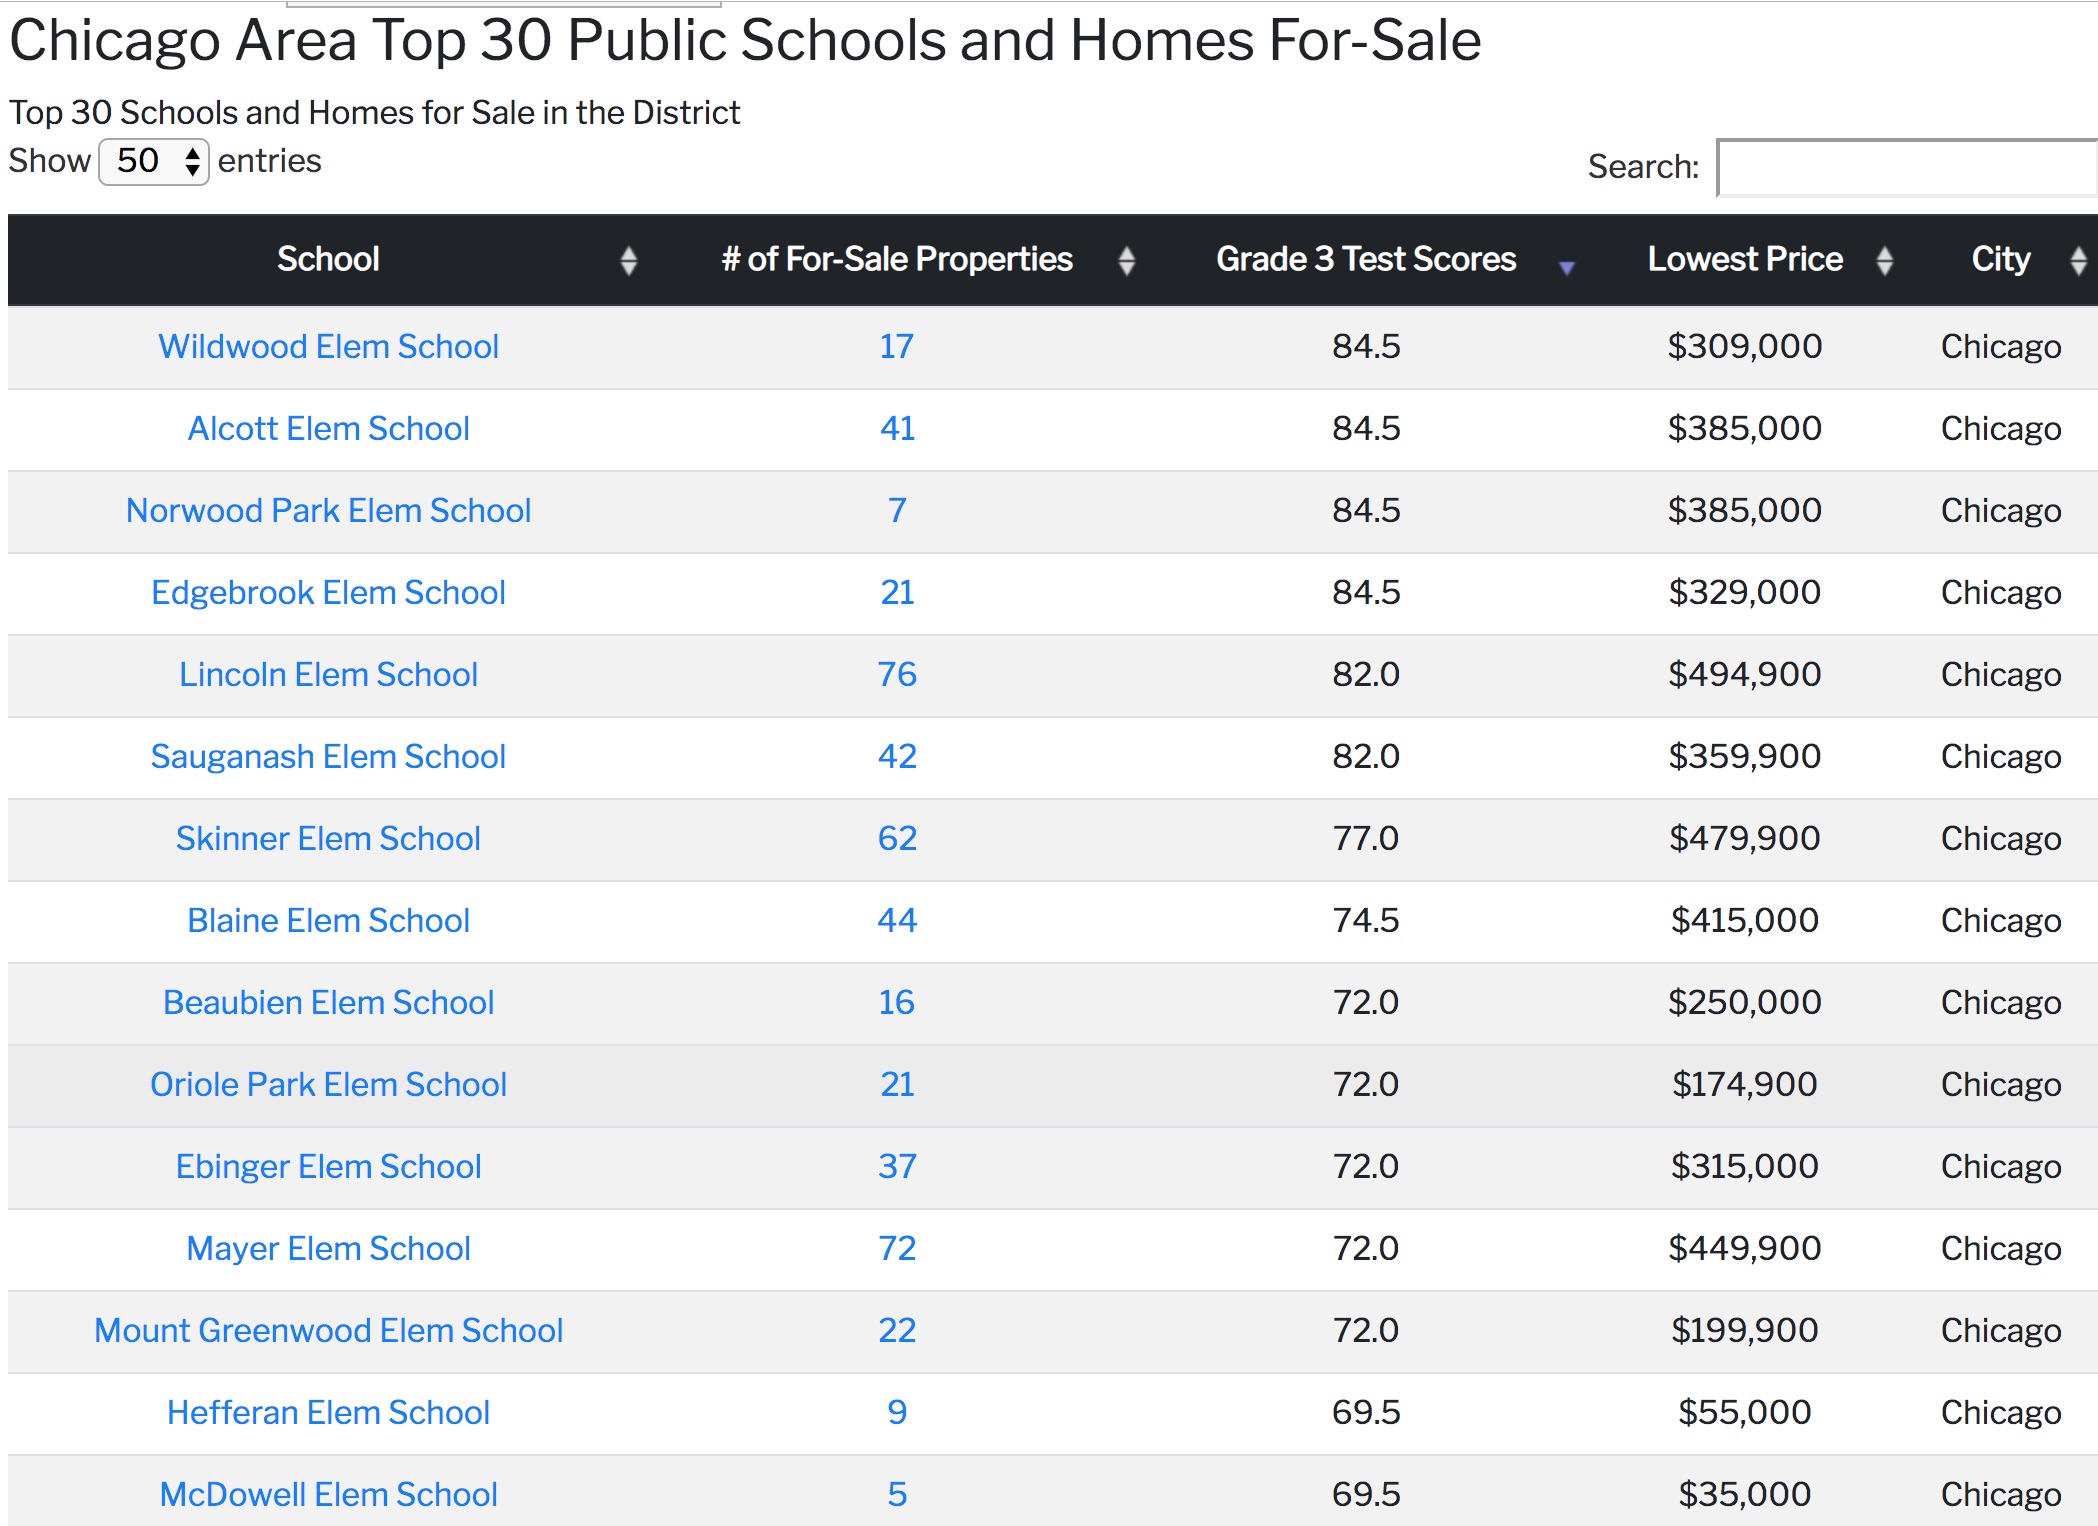
Top 30 School Search
Not sure which specific schools to search? Our top 30 search will find the Top 30 schools that have homes for sale right now that match your requirements!
Email Auto-notify*
Get Daily Email Auto-Notifications of New or Updated Properties in Your School(s) Attendance Boundaries


ECD Search
Try our ECD ranking option which ranks schools based on the test performance of the Economically Disadvantaged students at the school. Inspired by this post.
More Search Options
Get advanced search options to further narrow down your search results to include schools with properties that more closely match your requirements.
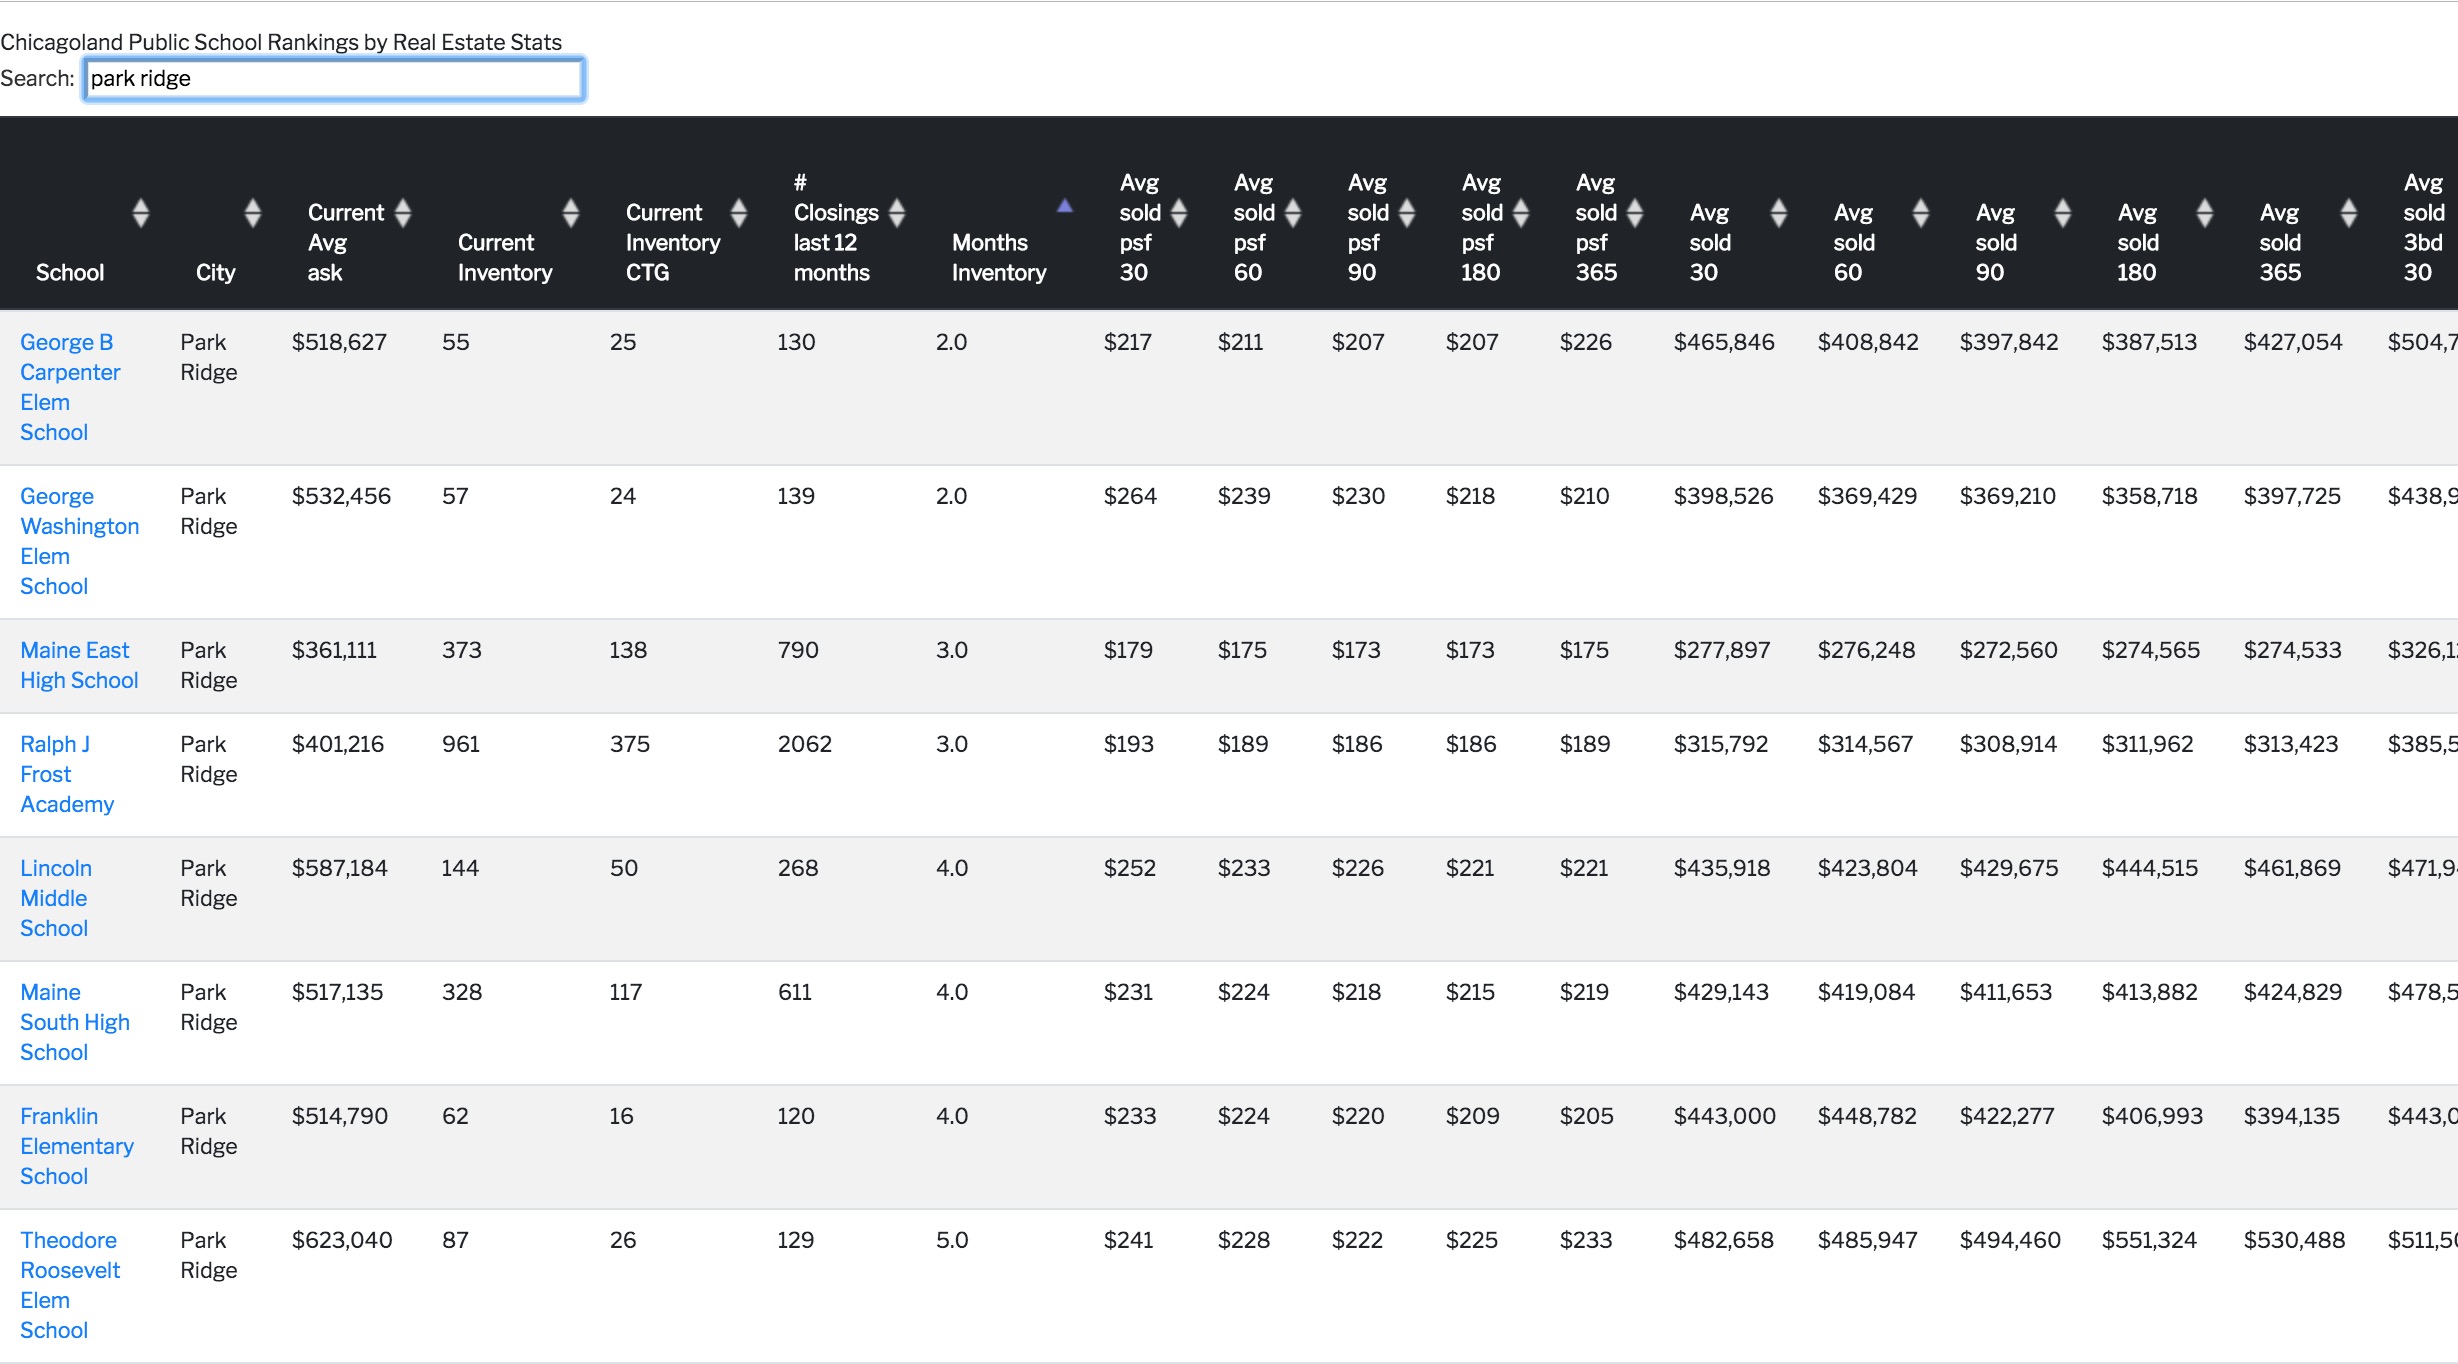
School-based Real Estate Data*
You get exclusive access to our real-time comprehensive Real Estate data, sortable and segmented by School.
Find Cities*
For Suburban buyers, you need this to be sure you are seeing all available properties in your school boundaries.

The #1 School-Based Search Engine
Full Access To Our Data, Sortable by Grade, School, City, District
Try Our Top 30 Schools Home Search
Log In
The #1 Property Search Engine when Schools are Important
Select The Grade by Which you Want Schools Ranked
When you enter a Grade, your search results will show listings in the school boundaries of public schools that have your indicated grade. Not all elementary schools are K-5; for example, some are K-3, and if you have a 4th grader, the K-3 school is not really an option for you.
Schools in your selected Location(s) will be ranked according to test scores for the GRADE you select. Test scores are segmented by grade for every school. Other sites show one overall school score, so if one lower grade has superior testing results compared to the higher grades, the overall school score does not move significantly. This is how SchoolSparrow provides an opportunity to possibly uncover schools that are improving from the bottom up, by ranking schools according to the grade you indicate. Testing starts in the 3rd grade, there is no data for K-2nd grade.
The #1 Property Search Engine when Schools are Important
Sort By ECD?
ECD is short for economically disadvantaged. Research has shown that high standardized test scores have more to do with the socio-economic status of the parents of children at a school as opposed to how well the school is teaching. Ranking schools according to how well economically disadvantaged students are performing on standardized testing could be more informative about how effective a school is at teaching. This article is the inspiration for this new ECD ranking option
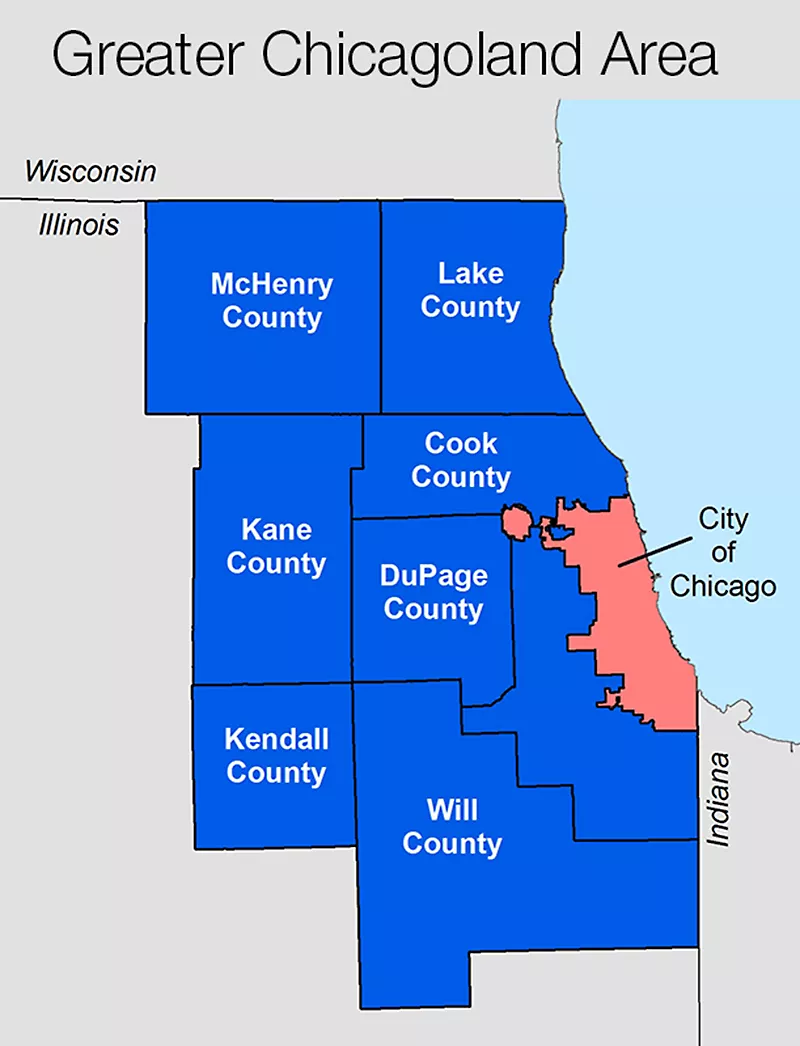
Chicago Area Map
The #1 Property Search Engine when Schools are Important
